The Sound of Science
There are many ways to “experience” scientific data. We see numbers portrayed in charts, arranged in graphs, and transcribed onto maps. These data-sharing methods may provoke emotion in some, such as wonder, excitement, or even confusion. Others may be left staring at a chart and wondering, “Why does this matter?”
The fifth-grade class at Mt. Eccles Elementary School discovered a new way to experience research and tell a story through data: sonification!
Data sonification transforms data points into sound. Surprisingly, sonification isn’t new. We are familiar with using sound to transfer information in the form of clocks in which every tick is a second, and a chime is an hour. Geiger counters, instruments used for detecting radiation, are another way we interpret information using sound. Recently, researchers have been transcribing their data points into musical notes as a new way to look for patterns and abnormalities in their data sets. Additionally, sonification can aid in accessibility, allowing those who cannot see data to experience it through hearing.
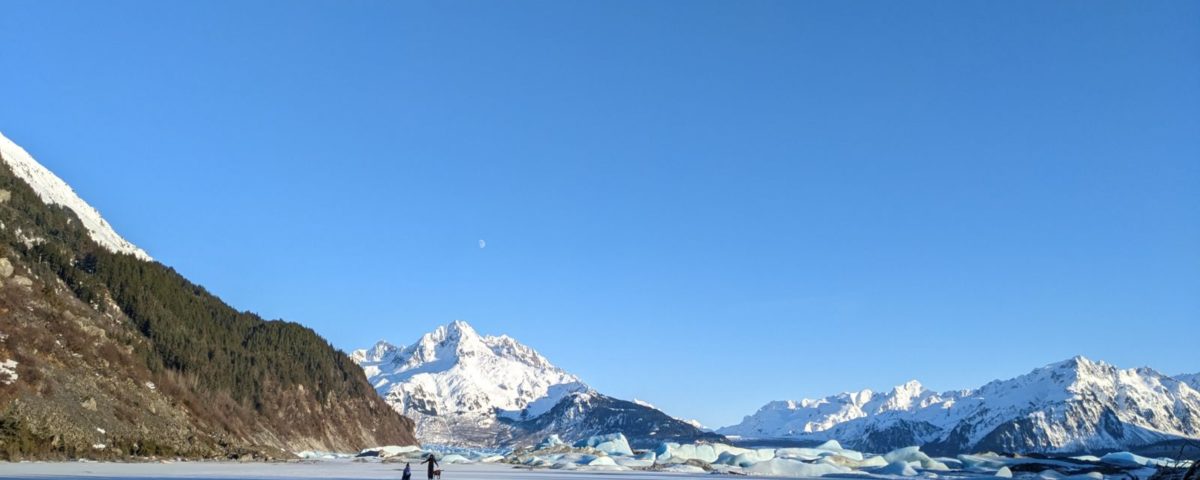
Sonification can also be used to evoke emotion and elicit curiosity and interest. Fifth-grade students were asked, “What does a melting glacier sound like?” They received a data set representing glacial mass, freshwater influx, and changing sea levels from 1956 to 2017. Using a computer program, TwoTone, students set the data to music. The data set was uploaded, and each data point was assigned a corresponding musical note. While scientists try not to personify or emotionalize their data through sonification, the fifth graders had artistic liberties to use musical variables to tell a story about the data set. Students experimented with different instruments, tempos, and musical keys to convey emotions. In their finished pieces, you can hear how the notes get higher pitched as the glacial mass decreases.
Below are the finished songs from two of the students. What emotions do these glacial songs evoke in you?
Audio Player

